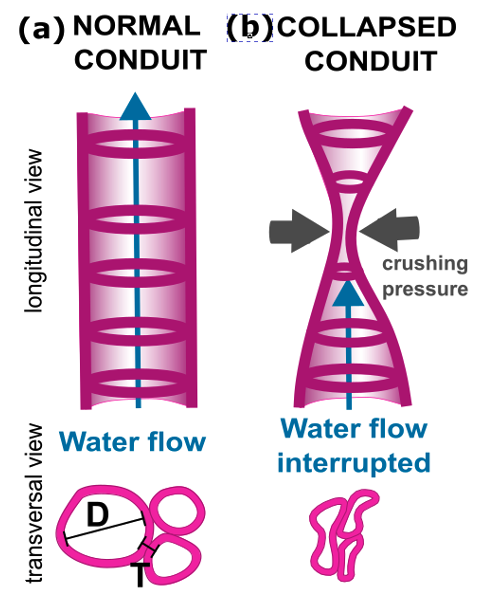
Like a straw can collapse under the suction of a thirsty drinker, the xylem conduits in leaves can collapse as water potential declines during droughts (Figure 1). In collapsed conduits the water flow is limited or even completely interrupted, so plants must reinforce their conduits to resist crushing pressures. The thicker the conduit double cell wall (T) relative to its maximum diameter (D), i.e. T/D, the greater the resistance against collapse. Having safer conduits (i.e. narrower and thicker conduits) may incur higher costs and reduced flow, while having less resistant xylem (i.e. wider and thinner conduits) may lead to catastrophic collapse under drought.
Figure 1. Collapse in leaf conduits. (a) Normal (uncollapsed) xylem conduit with uninterrupted water flow. (b) Collapsed xylem conduit with interrupted water flow. D = Maximum lumen diameter. T = Double cell wall thickness.
In our paper recently published in New Phytologist, we assessed over 7,000 xylem conduits in 122 plant species to investigate how plants scale T x D to trade off safety, flow efficiency, mechanical support, and cost (Figure 2).
Figure 2. Scaling scenarios for the log–log relationship between leaf conduit double-wall thickness (T) and maximum lumen diameter (D) for three hypothetical species (yellow, green, and orange). (a) Species have same slope (b coefficient) but different y-intercepts (a coefficients): a >0 (yellow line) – conduits have thicker cell walls relative to their diameter (i.e. higher lignification), potentially resulting in higher implosion safety across the entire venation network; a =0 (green line) – conduits have lower degree of lignification; a < 0 (orange line) – conduits have thinner cells walls relative to their diameter, potentially resulting in lower implosion safety across the entire leaf venation network. (b) Illustrations of how conduits T and D are expected to vary across vein sizes in each of the three scaling scenarios with same b but different a. (c) Species have same a but different b: b >1 (yellow line) – as conduits become wider their cell walls become proportionally thicker, resulting in greater xylem reinforcement and lower vulnerability to implosion in wider conduits; b = 1 (green line ) – conduits diameter and thickness increase proportionally, resulting in a constant safety implosion across conduits of different diameters; b < 1 (orange line) – as conduits become wider their cell walls become proportionally thinner, resulting in greater xylem reinforcement in narrower conduits, but potentially higher vulnerability to implosion in wider conduits. (d) Illustrations of how conduits T and D are expected to vary across vein sizes in each of the three scaling scenarios of same a but different b.
Overall, we found that leaf conduits become wider faster than thicker, showing a negative allometric relationship between T and D (Figure 3). This means that narrower conduits, which are usually subjected to more negative pressures, are proportionally more resistant to collapse than wider conduits. Despite this overall trend, T x D scaling varied across clades, habitats, growth forms, and vein orders. To learn more, access our full paper at https://doi.org/10.1111/nph.19771.
Figure 3. Standardized major axis (SMA) regression for the log–log relationship between leaf conduit double-wall thickness and maximum lumen diameter across 7,113 conduits measured from 122 species of fern and angiosperms. Values were log10-transformed before SMA regression, and then XY-axis were back transformed to their original units in 𝜇m. Black dashed lines indicate hypothetical isometric slope (b = 1.0) and positive allometric (b = 1.5) linear relationships between T versus D. Solid red line represents the actual estimated T versus D relationship, which conforms with a negative allometric relationship (b = 0.55; a= -0.11). Solid and thin black lines represent the 95% confidence interval for the SMA regression.


