Lab postdoc Ilaine shares her new paper in New Phytologist!
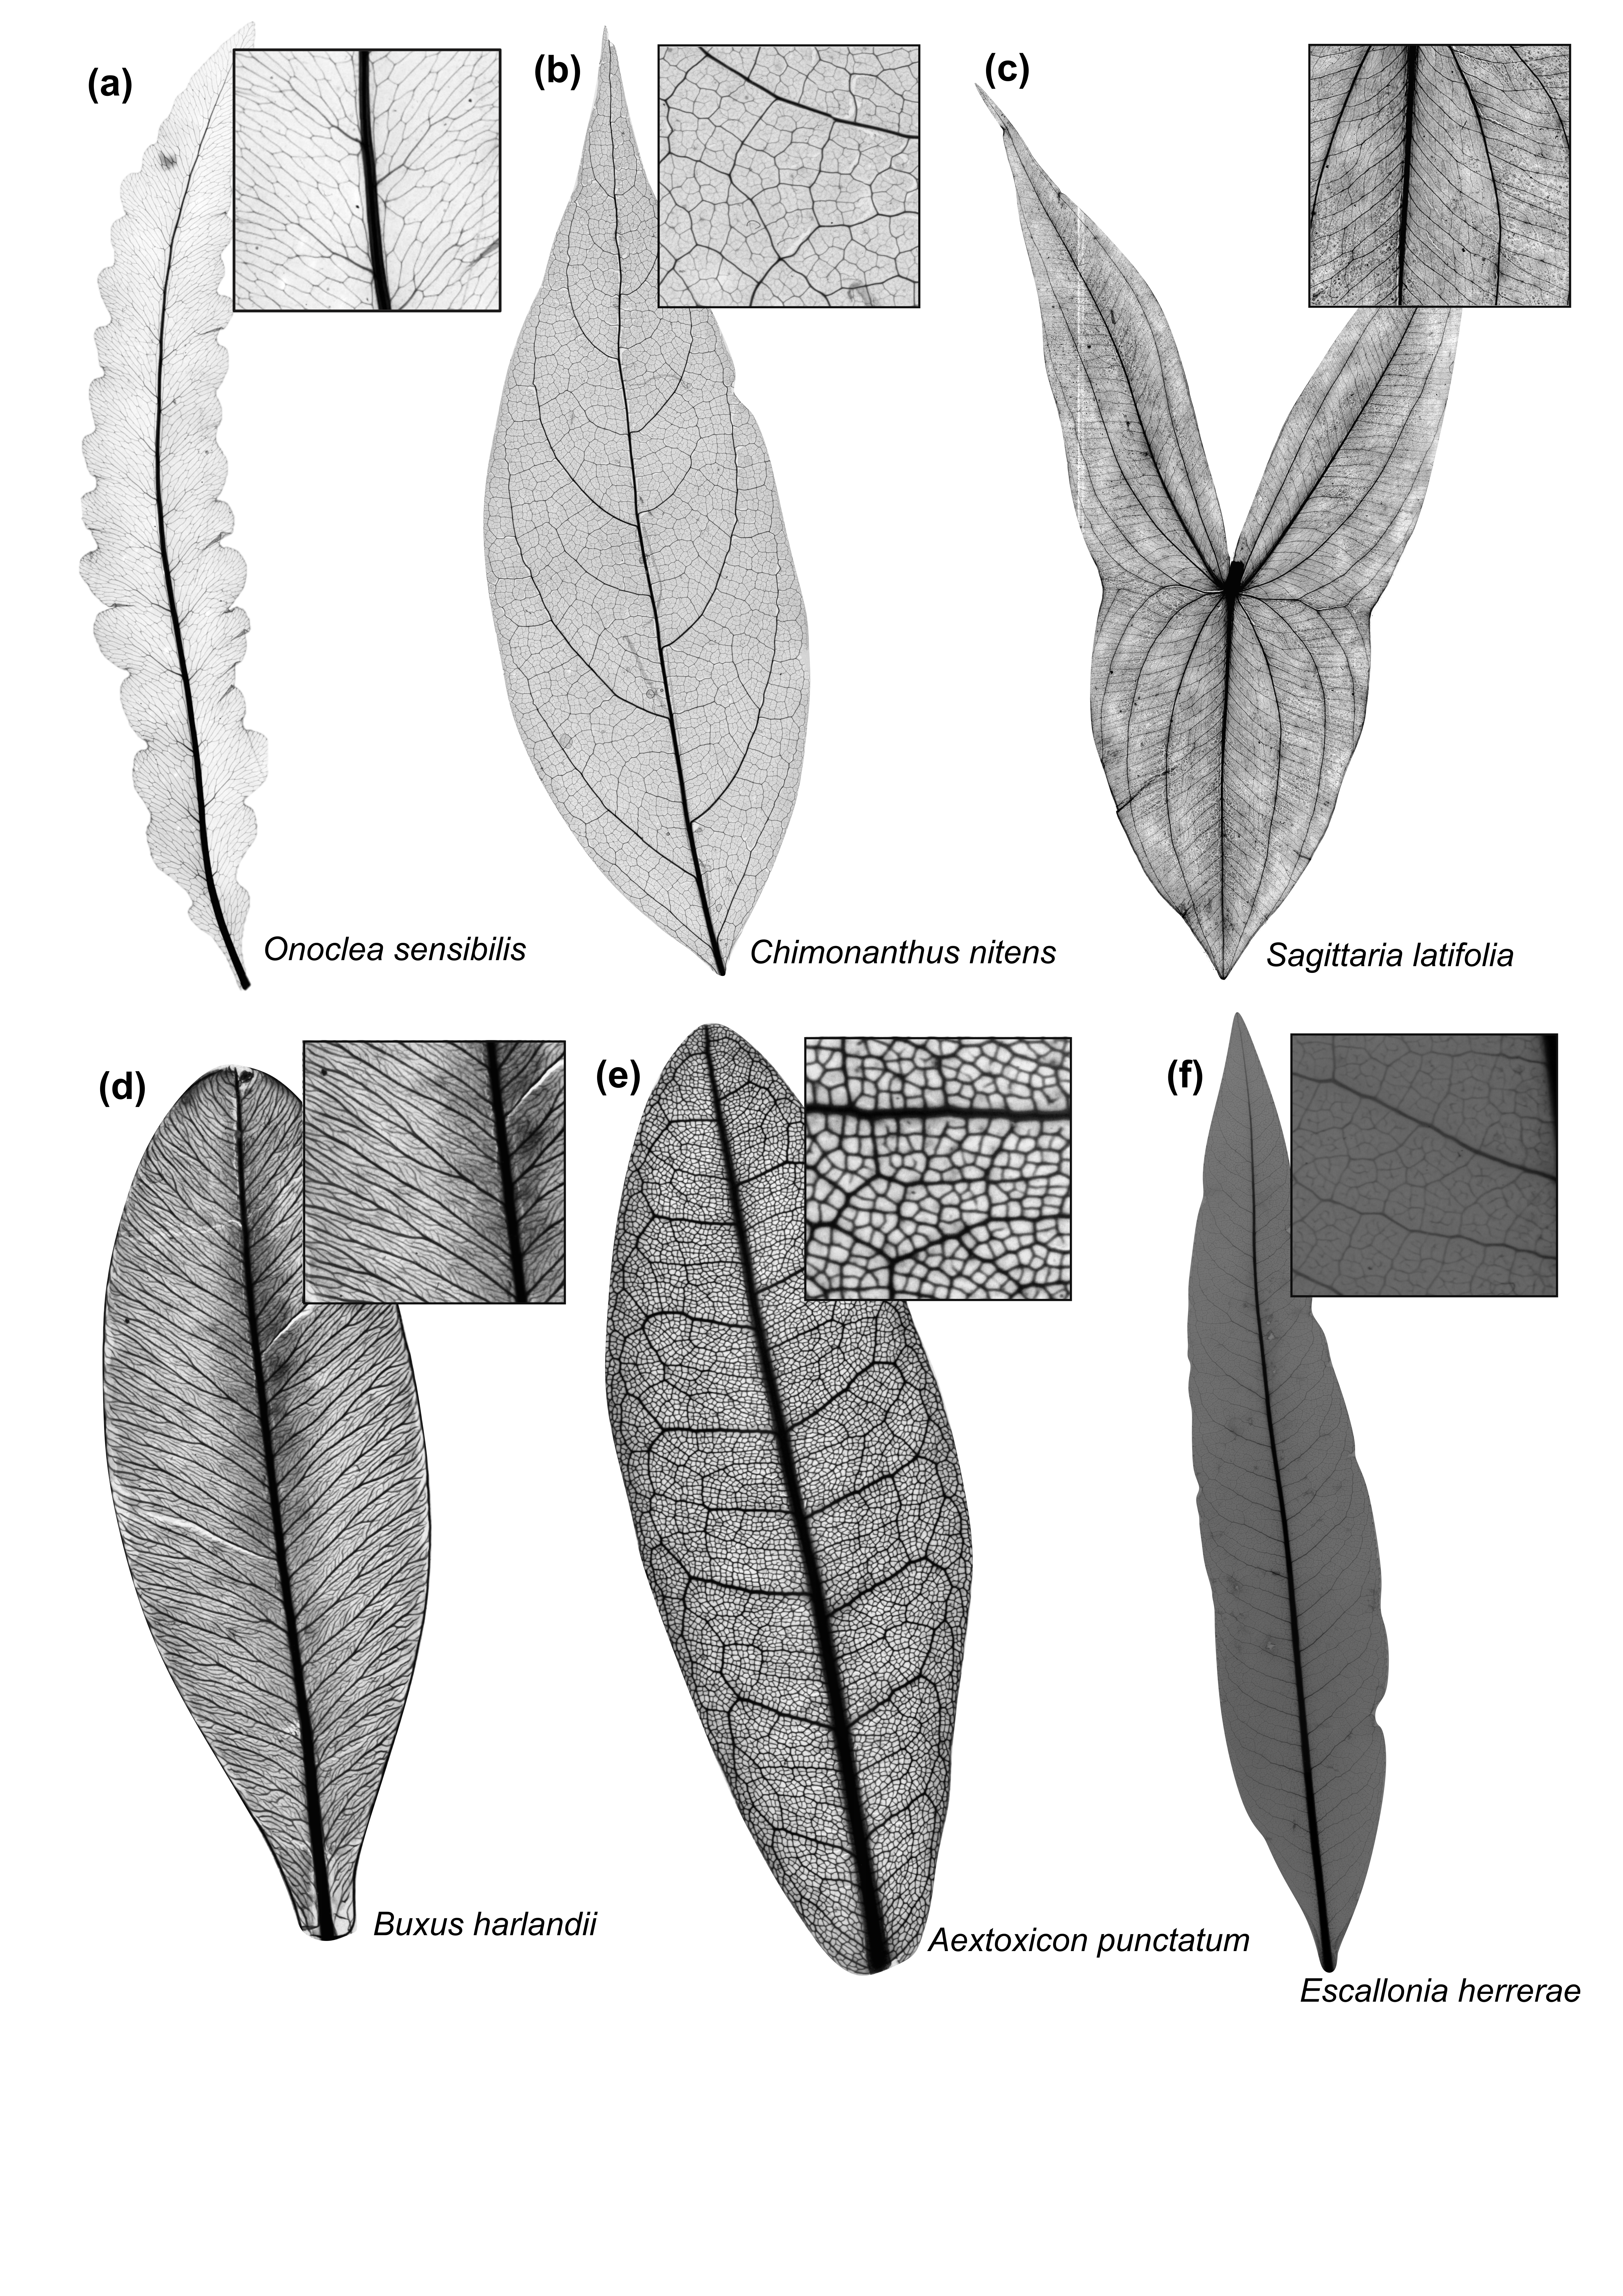
If you ever spend time looking at leaves of different species, you probably noticed that the way leaf veins are organized varies enormously (Fig.1). Some leaves only have a single vein, others exhibit complex venation networks with thousands of interconnected veins. Some networks are strictly branching, while others form a reticulated mesh with loops inside of loops. Those loops also vary in shape, sometimes being more circular, other times being more elongated.
 Figure 1. Examples of variation in leaf venation network architecture across plant clades: (a) Fern: Onoclea sensibilis L. (Onocleaceae); (b) Basal angiosperm: Chimonanthus nitens Oliv. (Calycanthaceae); (c) Monocot: Sagittaria latifolia Willd. (Alismataceae); (d) Basal eudicot: Buxus harlandii Hance (Buxaceae); (e) Rosid: Aextoxicon punctatum Ruiz & Pav. (Aextoxicaceae); and (f) Asterid: Escallonia herrerae Mattf. (Escalloniaceae).
Those observations lead to an inevitable question of why there exists such a diversity in venation architectures. One leading hypothesis is that different networks evolved to optimize different leaf functions (Fig. 2), including: (1) damage resistance to drought (leaf ability to avoid water flow interruption due to xylem conduit implosion or embolism), (2) damage resistance to herbivory (leaf ability to avoid water flow disruption caused by herbivores cutting veins), (3) damage resilience to drought and herbivory (leaf capacity to maintain flow after damages have occurred), (4) flow efficiency (how efficiently water flows through the leaf), and (5) mechanical support (leaf capacity to remain upright in space), which must be traded-off against (6) the leaf construction cost.
Figure 2. Hypothesized combinations of leaf venation architecture traits (ER, loop elongation ratio; MST, minimum spanning tree ratio; VD, vein density) at three vein spatial scales (small, medium, and large) that would have evolved if each leaf functional axis was independently optimized: (a) Radar chart of hypothesized trait combinations. (b) Damage resistance to drought should be higher in networks with lower density of large veins (low VDlarge), branching large and medium veins (low MSTlarge and MSTmedium), and more circular loops in small veins (low ERsmall); (c) Damage resistance to herbivory should be higher in networks with higher large vein density (high VDlarge) and more circular loops at all scales (low ER); (d) Damage resilience to drought and herbivory should be higher in networks with higher density of large and small veins (high VDsmall and VDlarge), palmate venation (more than one midrib), and more loops (low MST) at all scales; (e) Flow efficiency should be higher in networks with higher density (high VDsmall) of branching (high MSTsmall) small veins; (f) Mechanical support should be higher in networks with higher large vein density (high VDlarge) and more loops in small veins (low MSTsmall); and (g) Construction cost should be higher in networks with higher density (high VDlarge and VDmedium) of large and medium veins.
Due to biophysical and physiological constraints, it might be impossible to construct a network that simultaneously optimizes all those functions. Thus, depending on the selective forces under which plants have evolved, they may have developed different network architectures as compromises among multiple functions.
In our new paper at New Phytologist, we measured architecture and functional traits on 122 ferns and angiosperms species to describe how those architecture-function trade-offs vary across plant clades and vein spatial scales (small, medium, and large vein width). We found that although generalized architecture-function trade-offs are weak, venation architecture strongly predicts leaf support and damage resistance axes. But weakly predicts efficiency and resilience axes. Architecture traits at different spatial scales contribute to different functional axes, allowing plants to independently modulate different functions by varying network properties at each scale. This independence of vein architecture traits within and across spatial scales may enable evolution of multiple alternative leaf network designs with similar functioning (Fig. 3).
Figure 3. Radar charts, based on observed data, for the combination of leaf venation architecture traits (ER, elongation ratio; MST, minimum spanning tree ration; VD, vein density) at three vein spatial scales (small, medium, large) that maximizes each leaf functional axis independently: (a) Resistance to drought – P50 (leaf water potential inducing 50% decline in leaf hydraulic conductance), (b) Resistance to herbivory – SWPlamina (specific work to shear leaf lamina), (c) Resilience – ΔKleafmean (percentage decline in leaf hydraulic conductance after damage), (d) Efficiency – Kleafmax (maximum leaf hydraulic conductance), (e) Mechanical support – εlamina (leaf flexural modulus of elasticity for the leaf lamina), (f) Construction cost – leaf mass per area. In the radar charts, point sizes indicate the predictor variable importance, with bigger points reflecting higher importance; whereas the point position along the predictor variable axis (low, medium, and high) indicates the SHapley Additive exPlanation value contribution. For each functional axis, we also show a hand-selected example of a real leaf venation network that approximates this ‘optimum’ combination of leaf venation architecture traits. Zoom insets for each image show small, medium, and large veins as light green, orange, and purple lines, respectively.


