Do too much fieldwork and a scientific debate can build up without you noticing. I’m wrapping up a summer in the Rockies and have begun to notice the growing interest and controversy over hypervolumes concepts in ecology. The debate has involved my own work, and it is exciting to trace the threads of its origin and current directions.
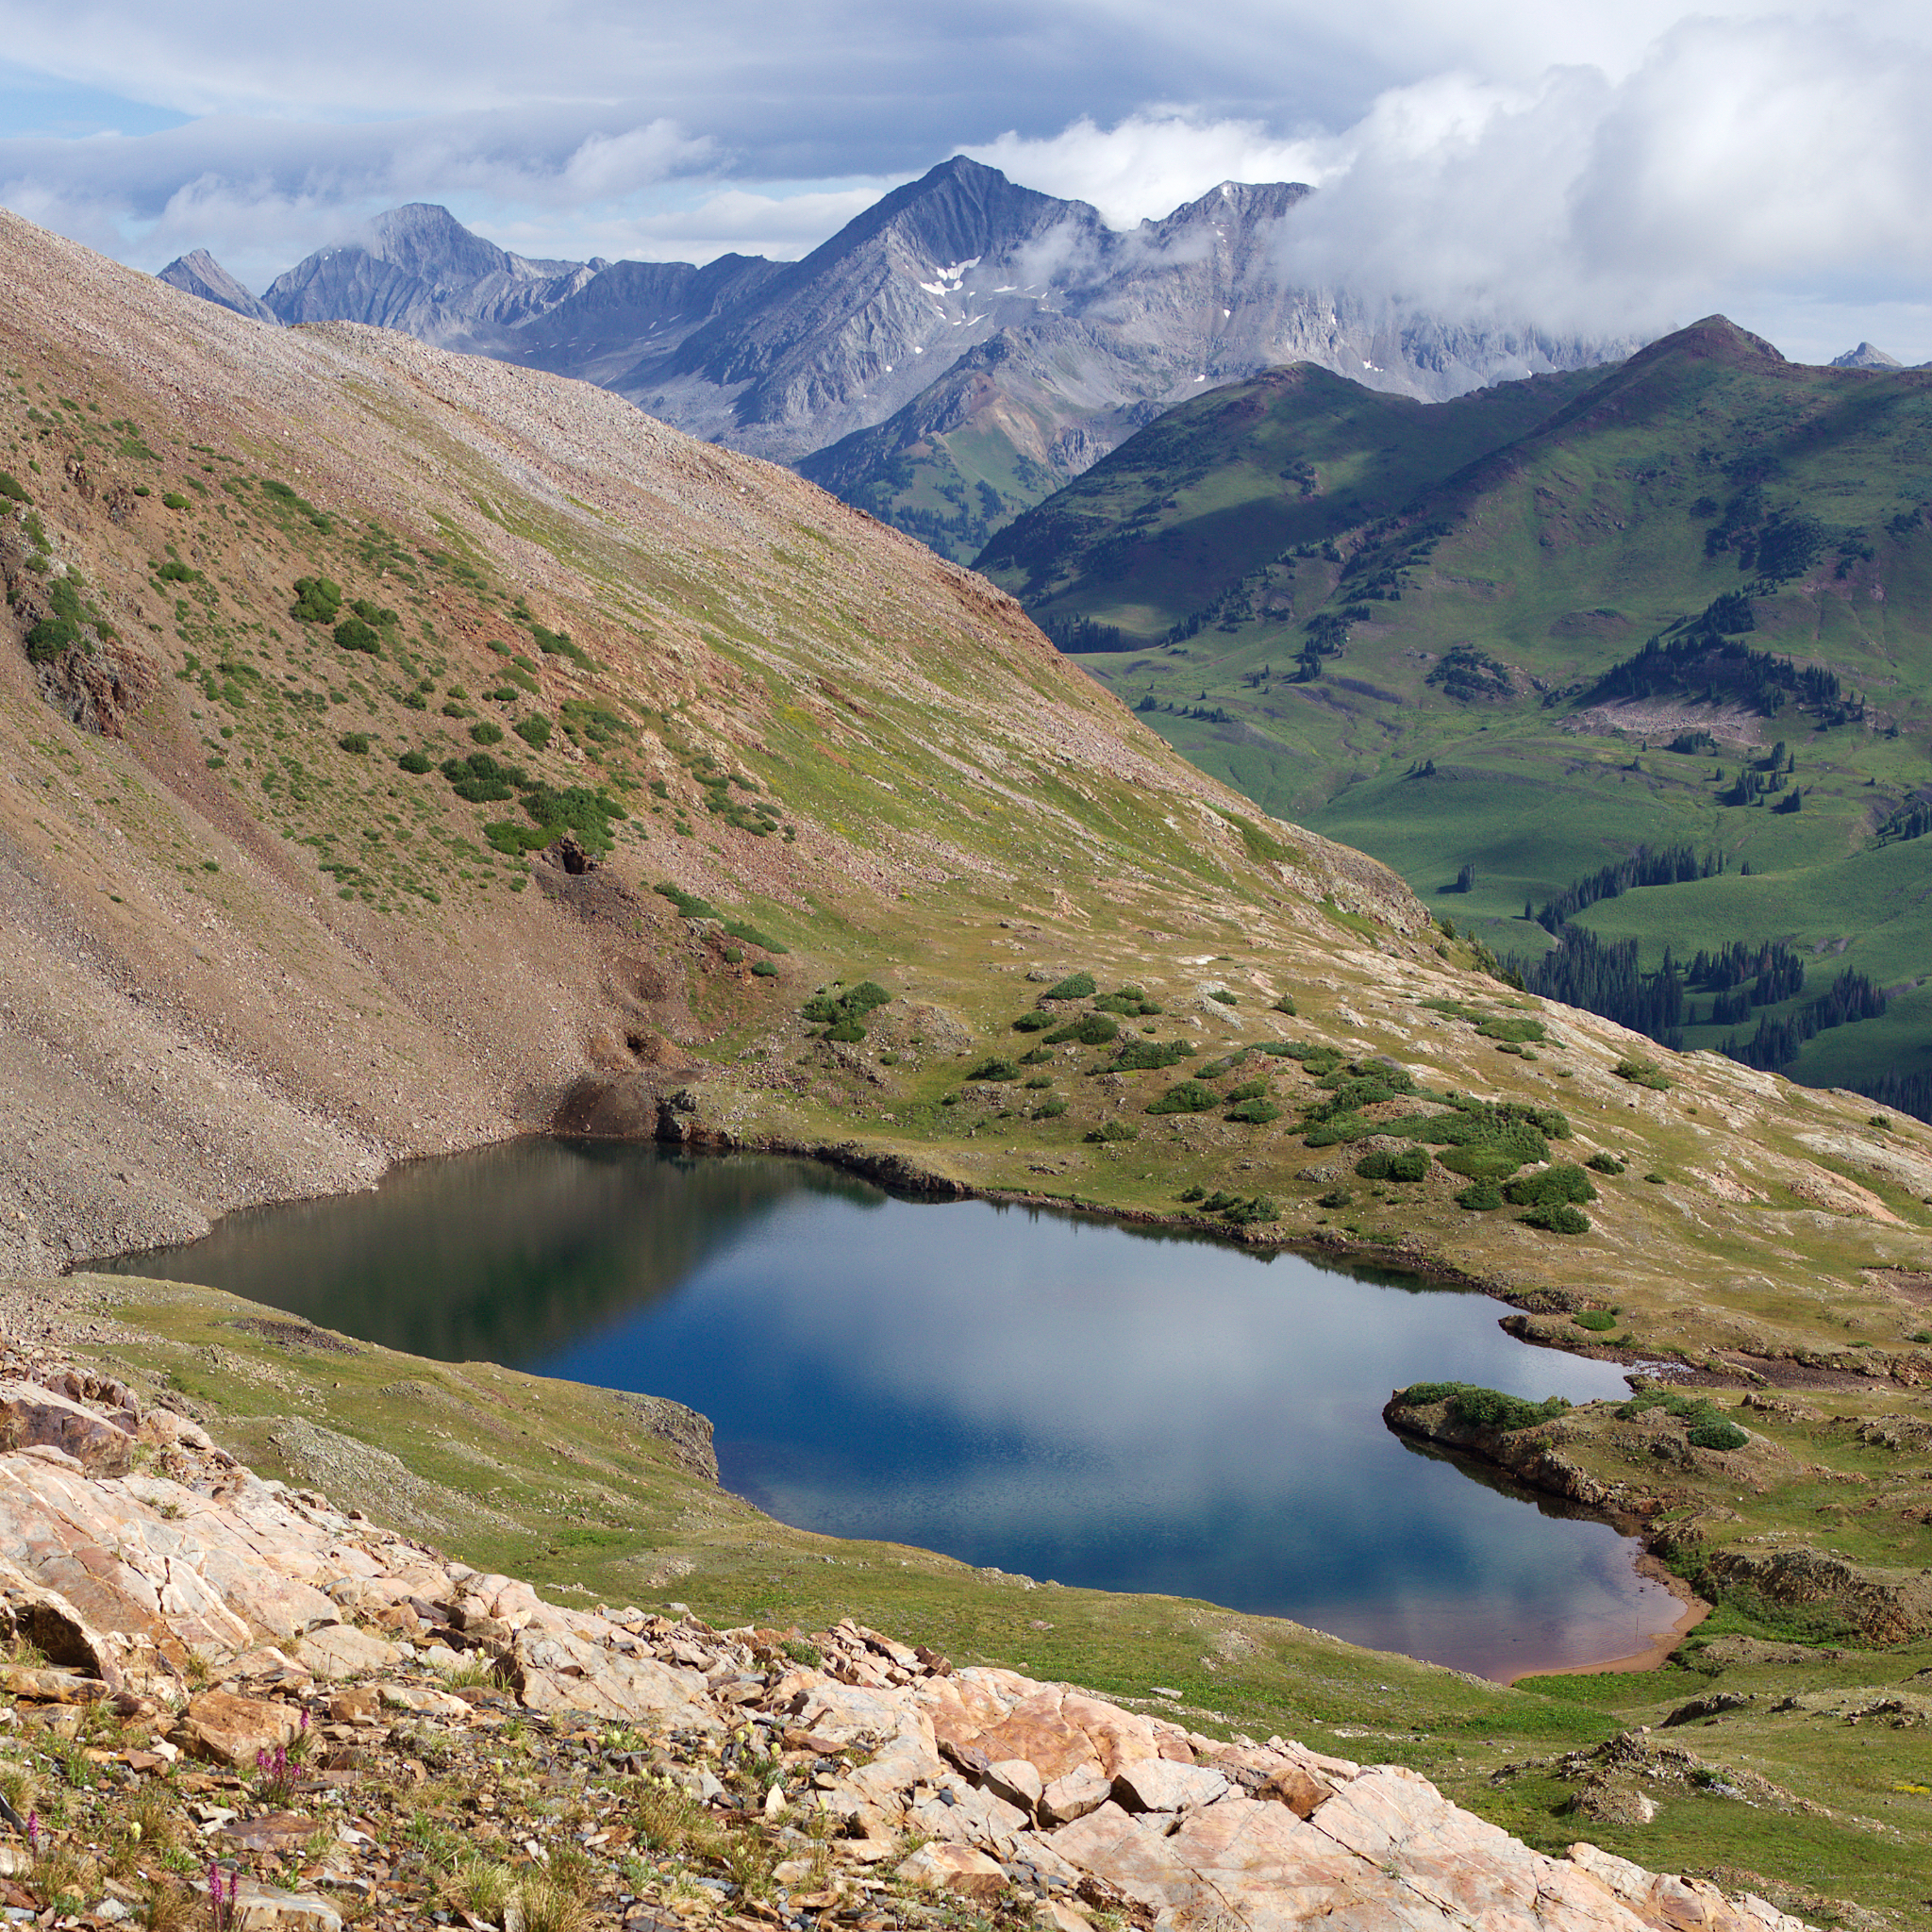
Hypervolumes have been widely used to describe the Hutchinsonian niches of species – their responses to the environment, via the resources and conditions they depend on. For example the willow shrubs (Salix spp.) in this photo may only be able to grow in locations corresponding to certain combinations of temperature, rainfall, snowpack duration, and nitrogen availability, while the subalpine fir trees (Abies lasiocarpa) in the valley below might require other combinations. Each variable represents an axis, and the combinations used by each species its niche.
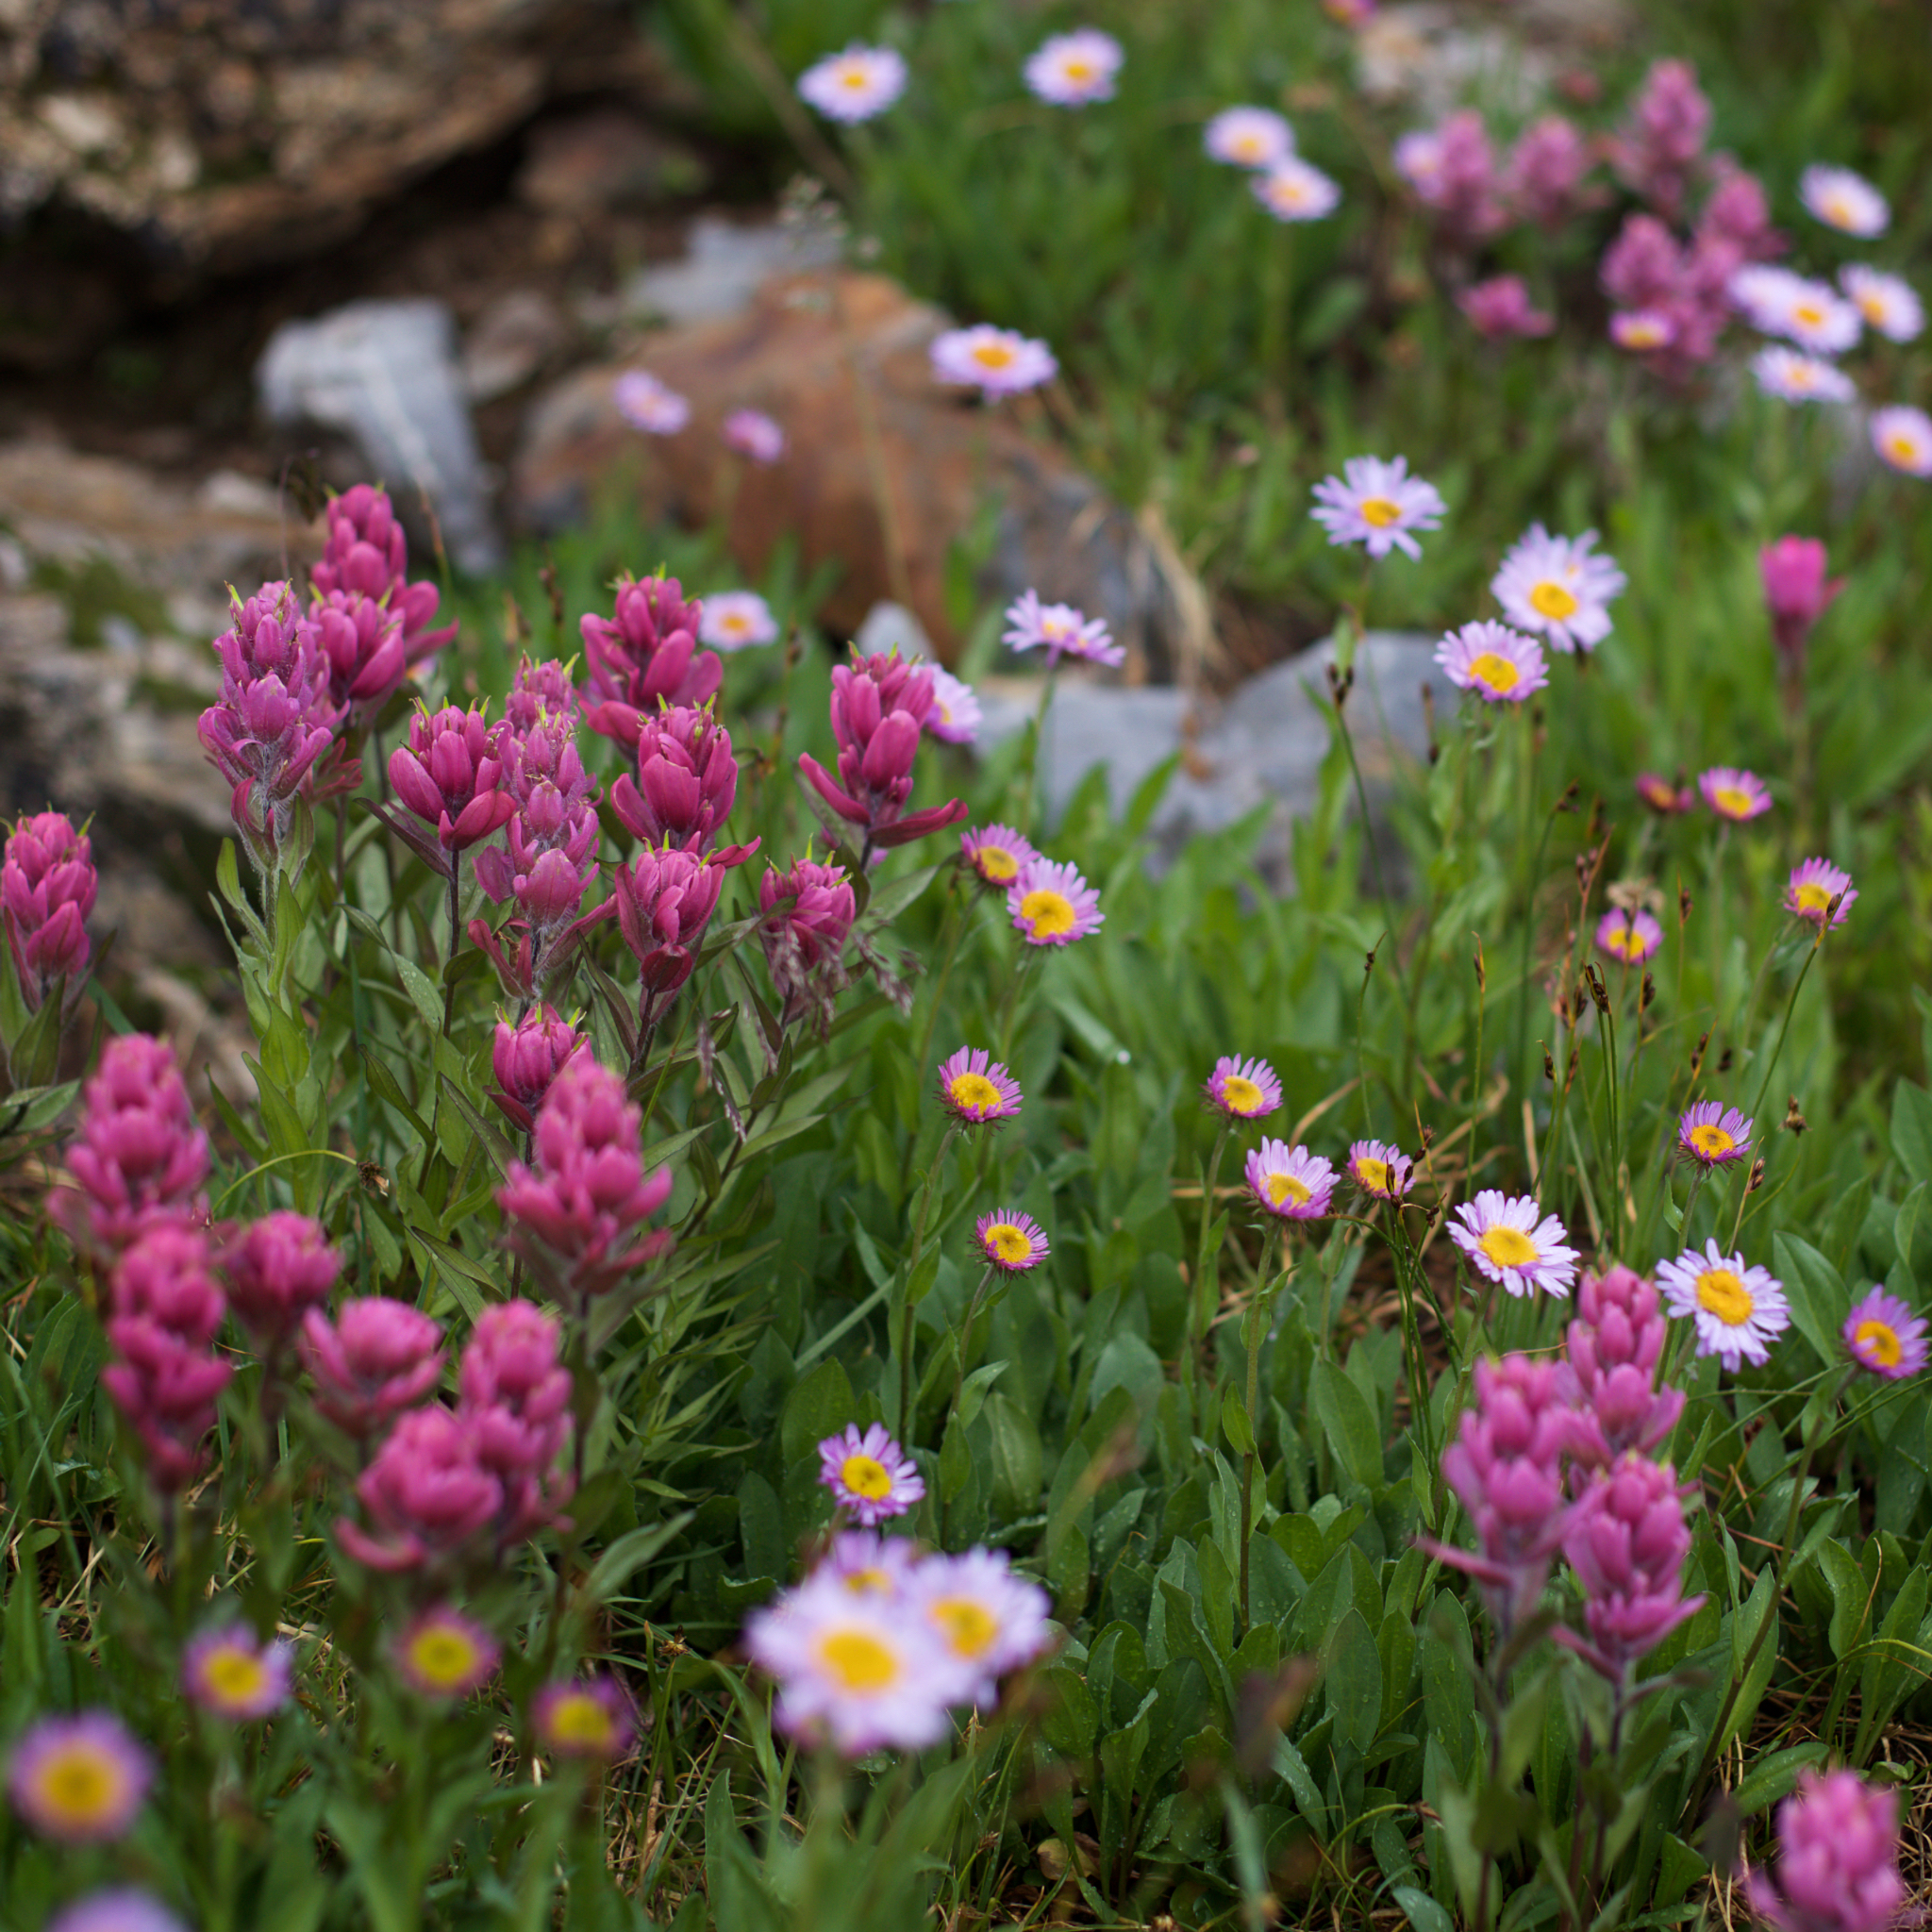
Similarly, hypervolumes are also used to describe the functions and traits of species – their morphology and their interactions with the environment. For example the paintbrush (Castilleja rhexifolia x miniata?) flowers could be described by a combination of axes corresponding to height, flower color, photosynthetic rate, and so on, contrasting with values for the daisy (Erigeron glacialis).
Measuring these hypervolumes, whatever the axes, has proven to be of wide interest, with applications from biodiversity conservation, invasion ecology, community assembly, and ecosystem functioning. But there is not yet agreement on the best way to measure them – leading to the present controversy.
The idea of a hypervolume dates back to Hutchinson in 1957 and was originally implemented as a range box that would independently enclose data along each axis. More recent extensions (e.g. Cornwell et al. [2006]) transformed this idea to convex polygons that would minimally enclose the data. In 2014, I worked with Cyrille Violle, Christine Lamanna, and Brian Enquist to extend this idea to multivariate kernel density estimation, an approach that provides a closer ‘wrap’ of the hypervolume to the underlying data (Blonder et al. [2014]), potentially better modeling the true shape of hypervolumes.
Since then, a diversity of approaches have appeared, each with its own philosophical underpinnings and tradeoffs. For example, our hypervolume approach allows the description of arbitrarily complex shapes and is computationally efficient when the number of niche dimensions is large; the tradeoff is that the scientist must specify some additional parameters to control the boundary of the hypervolume.
Swanson et al. (2015) recently published “A new probabilistic method for quantifying n-dimensional ecological niches and niche overlap”. This approach uses multidimensional ellipses to fit the data. It cannot describe complex shapes but if data are thought to be truly rotated ellipses (multivariate normal) then it has excellent performance.
Similarly, Junker et al. (2016), recently published “Dynamic range boxes – a robust nonparametric approach to quantify size and overlap of n-dimensional hypervolumes”. This approach extends range boxes to a quantile-based approach that is computationally fast and should be less sensitive to outliers, although it also only can describe simple shapes (rotated data are potentially problematic as well, though the authors propose an approach to address this). On the other hand, it might have better performance in high dimensions than our approach, at least with default parameter settings.
Alternatively, Carmona et al. (2016) have published “Traits Without Borders: Integrating Functional Diversity Across Scales”, which proposes a fully probabilistic approach to estimating hypervolumes. This approach shares several motivations with our hypervolume approach, but differs primarily in how and when the hypervolume’s boundaries are delineated. It also is implemented via different algorithms.

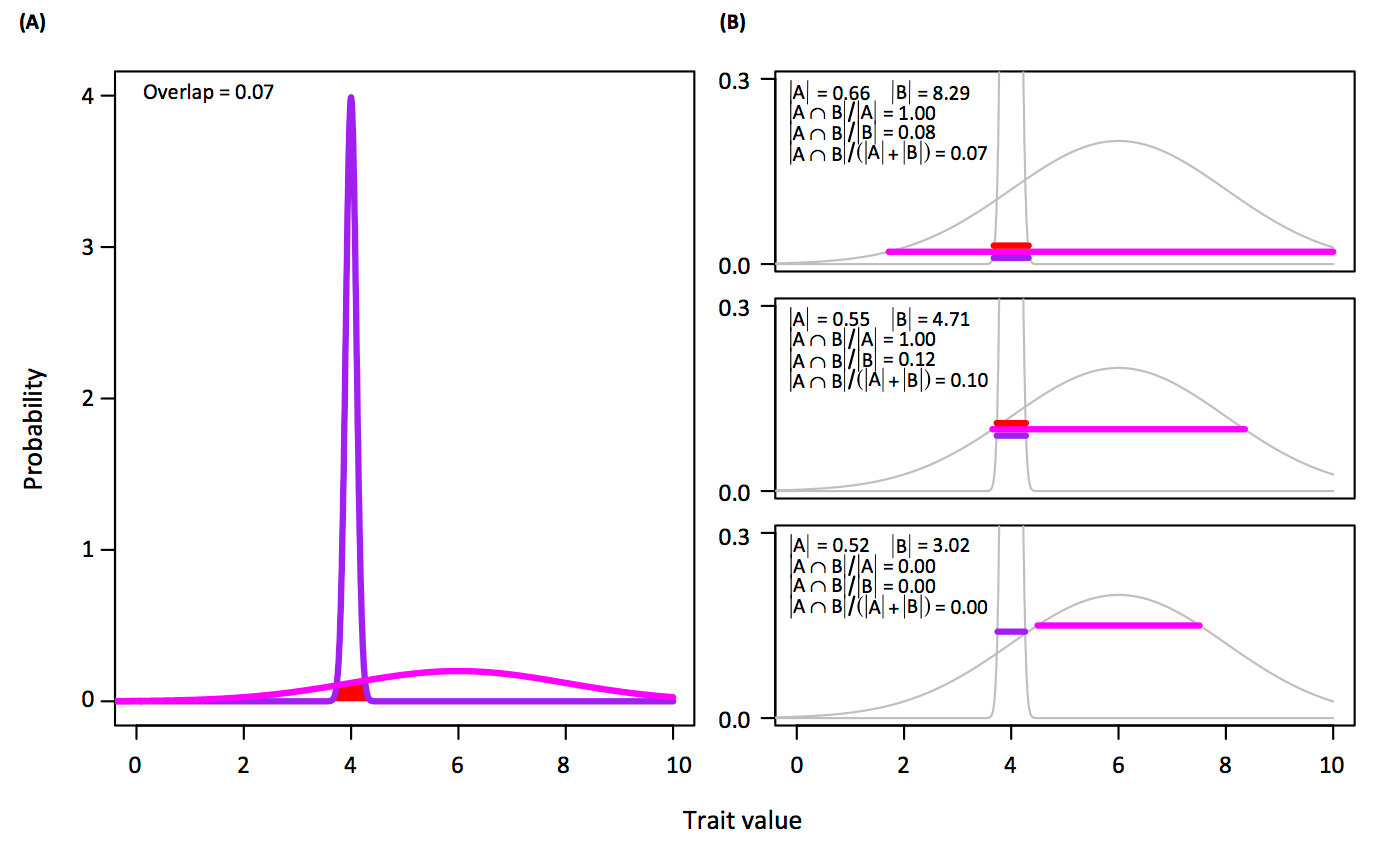
We do disagree on several points, and last month had a friendly discussion around these issues in Trends in Ecology and Evolution. You can read my piece (Pushing Past Boundaries for Trait Hypervolumes: A Response to Carmona et al.) and his response (The Density Awakens: A Reply to Blonder) to see the full debate. I reproduce a figure from my piece below, showing the difference between Carmona’s approach for hypervolume overlap on the left and the several approaches for overlap using our approach on the right. You can see that the ability to choose a threshold for overlap on the right (as we propose) yields a range of possible outcomes, which is either beneficial or detrimental depending on your view of hypervolume concepts.
Another research group has also just added to this debate. Qiao et al. (2016) just published “A cautionary note on the use of hypervolume kernel density estimators in ecological niche modelling”, which suggests that simpler approaches that proposed by our group or Carmona’s group may be better suited for predicting species’ geographic distributions. They propose that boxes and ellipses are better assumptions for fundamental niches than the complex shapes that kernel density estimation can produce. I agree with this general point, but also think that more complex shape descriptors have important places for describing realized niches and for describing all trait hypervolumes.
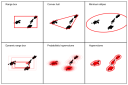
To get a better sense of what each of these approach is doing, it can be instructive to look at some data. Here is an example of what each approach does for a simple dataset, with the approximate shape according to each method drawn in red.
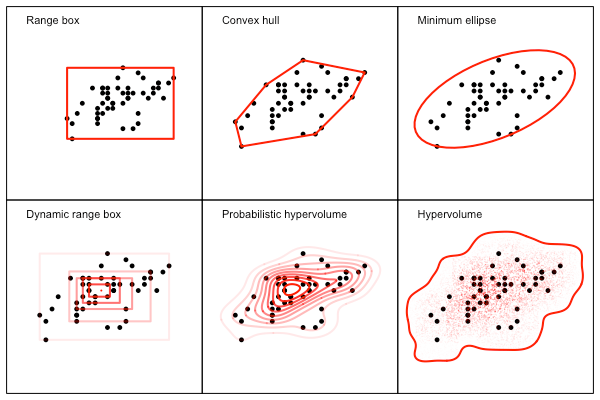
In this case all of the methods seem to produce roughly similar results, although ability of each approach to either capture (or remove) complexity in the data is variable. The difference between methods becomes clearer with a more complex and holey dataset seen below.
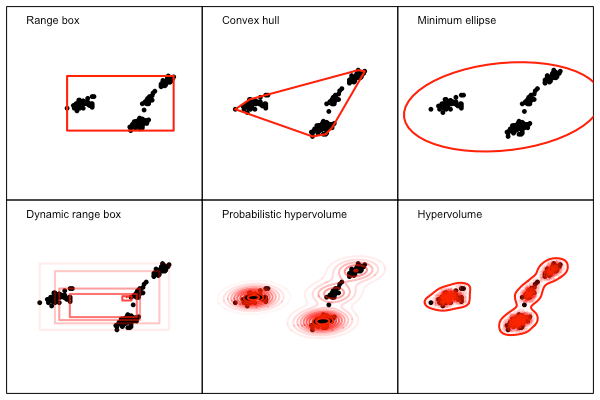
Here the more complex methods provide a much tighter fit to the data than the simpler methods – but if the reason for holes in the data is actually under-sampling, then potentially the simpler methods are actually better. This example is also illustrated in two dimensions only. Only the methods in the first and third column are computationally feasible in high dimensions.
Is there a ‘right’ method for measuring a hypervolume? I don’t think there is a unique best way to do things. Each of these approaches has certain upsides and downsides, and may be more suitable for certain applications based on the intent of the scientist. For example, our hypervolume approach is probably less suitable for species distribution modeling than the ellipse method, while the converse would be true for assessing overlap in bird morphology.
Try out each of these methods – they all are associated with R packages – and see what works best for your application. In the meantime our group is working on a comparative study of all these methods, and is refining our hypervolume approach in some new ways that I’ll be able to share soon.
It is exciting to see this diversity of approaches, and for the field to engage in active discussion about the assumptions and implications of each. This is exactly the kind of discussion that deepens conceptual understandings and then produces better science.
